
Select version
BLIND-CAM
A handheld scope for the invisible world.
Real-time Wi-Fi Channel State Information (CSI) visualization powered by ESP32.
The "Blind" Concept
Cameras capture light; the Blind-Cam captures data. We are swimming in a sea of Wi-Fi signals that bounce off walls, furniture, and bodies.
By decoding the Channel State Information (CSI) on a portable device, we can "see" movement and environmental changes without a lens. It effectively acts as a handheld sonar for the electromagnetic spectrum.
CURRENT CAPABILITIES
- ✔ Sniffer Mode: Passive traffic monitoring.
- ✔ Portable: Battery operated & self-contained.
- ✔ Live Viz: 60FPS TFT rendering.
- ⏳ Station Mode: Uplink injection (In Dev).
Modular Housing Design
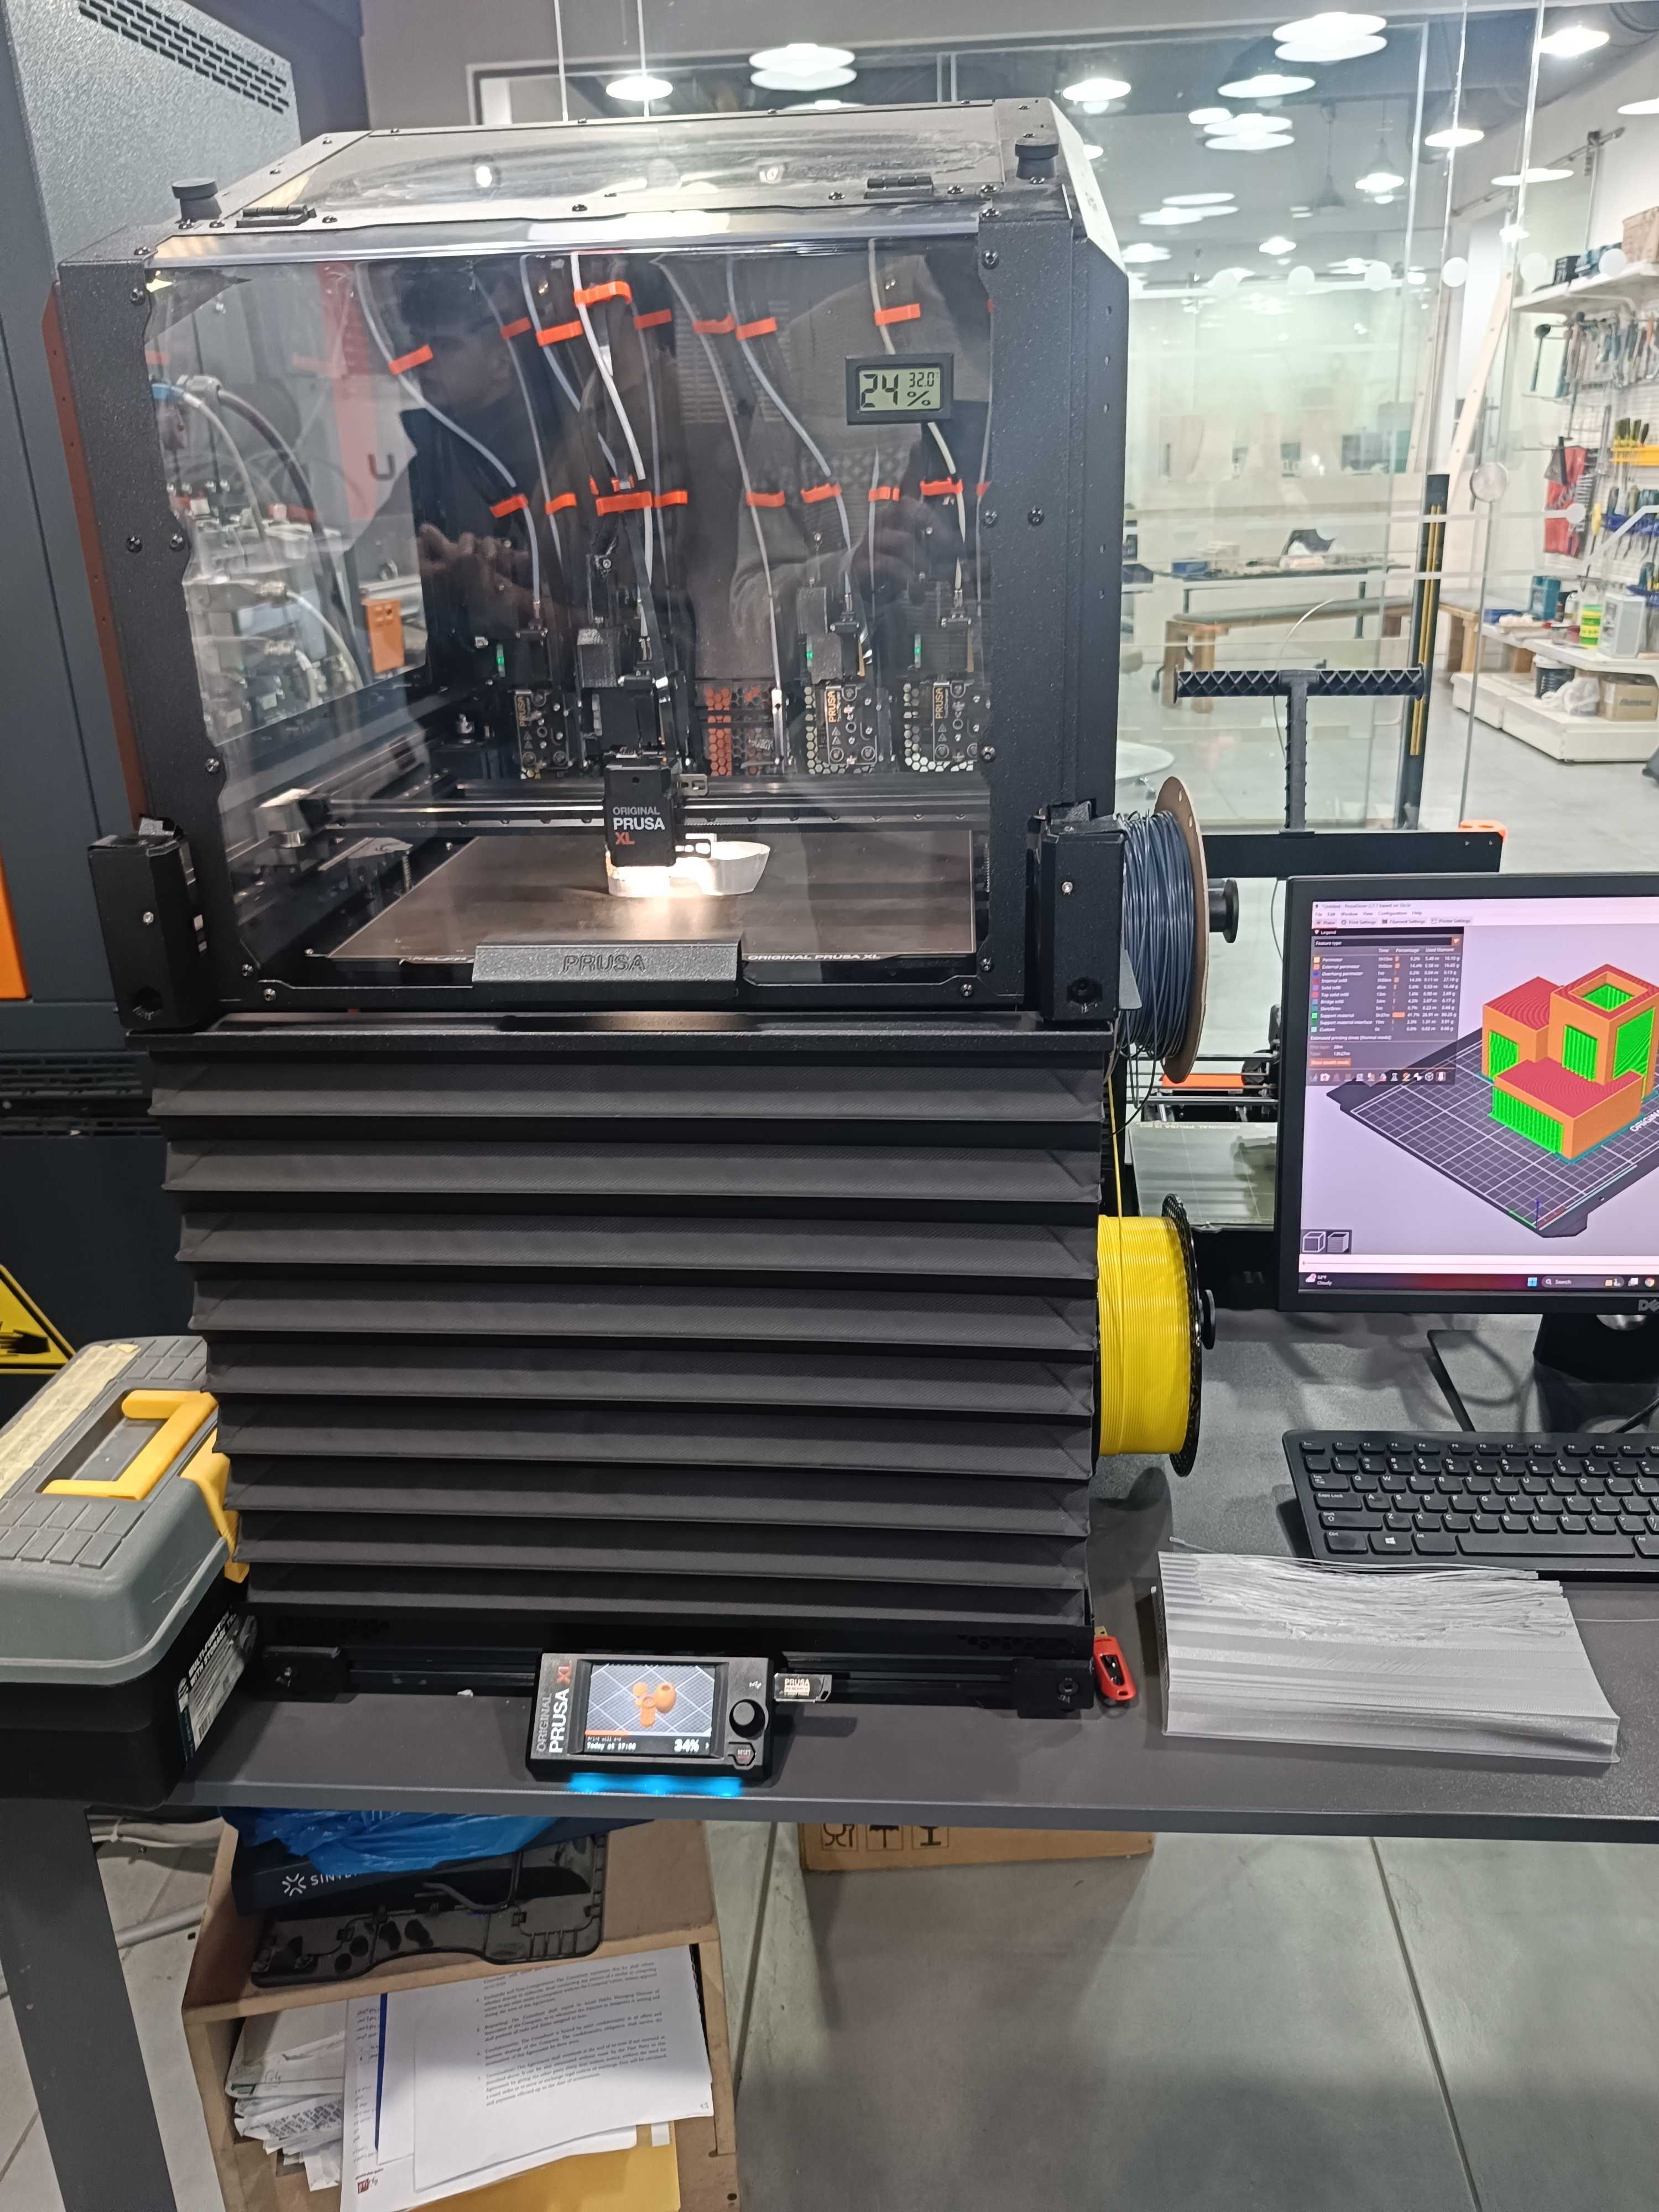
Designed in CAD and fabricated at the Makers Space, the unit is split into two distinct functional modules (body & cover) to allow for easy maintenance and friendly design.
01. The Body
Friction-fit enclosure for the ESP32 & TFT.
02. The Cover
Easy on/off cover for simple assembly.
Component Manifest
Low cost, high availability parts.
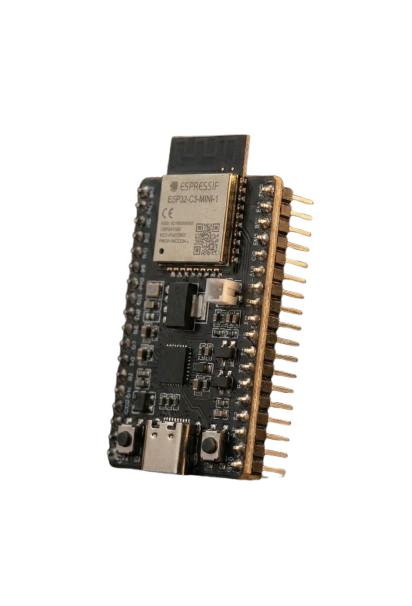
ESP32
The brain. handling high-frequency CSI packet sniffing.
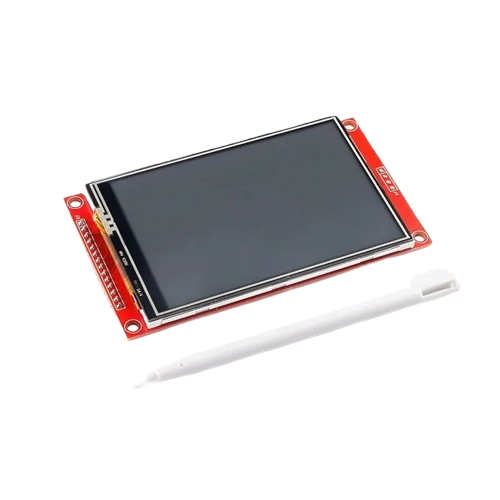
1.8" TFT Display
SPI Interface screen for real-time spectral rendering and histograms.
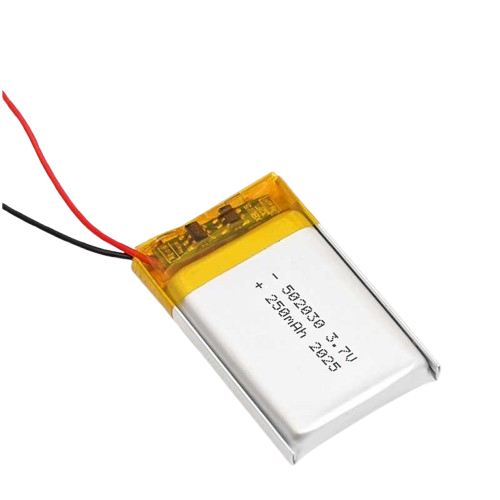
LiPo Power
Internal rechargeable power source for true cordless field analysis.
Field Test
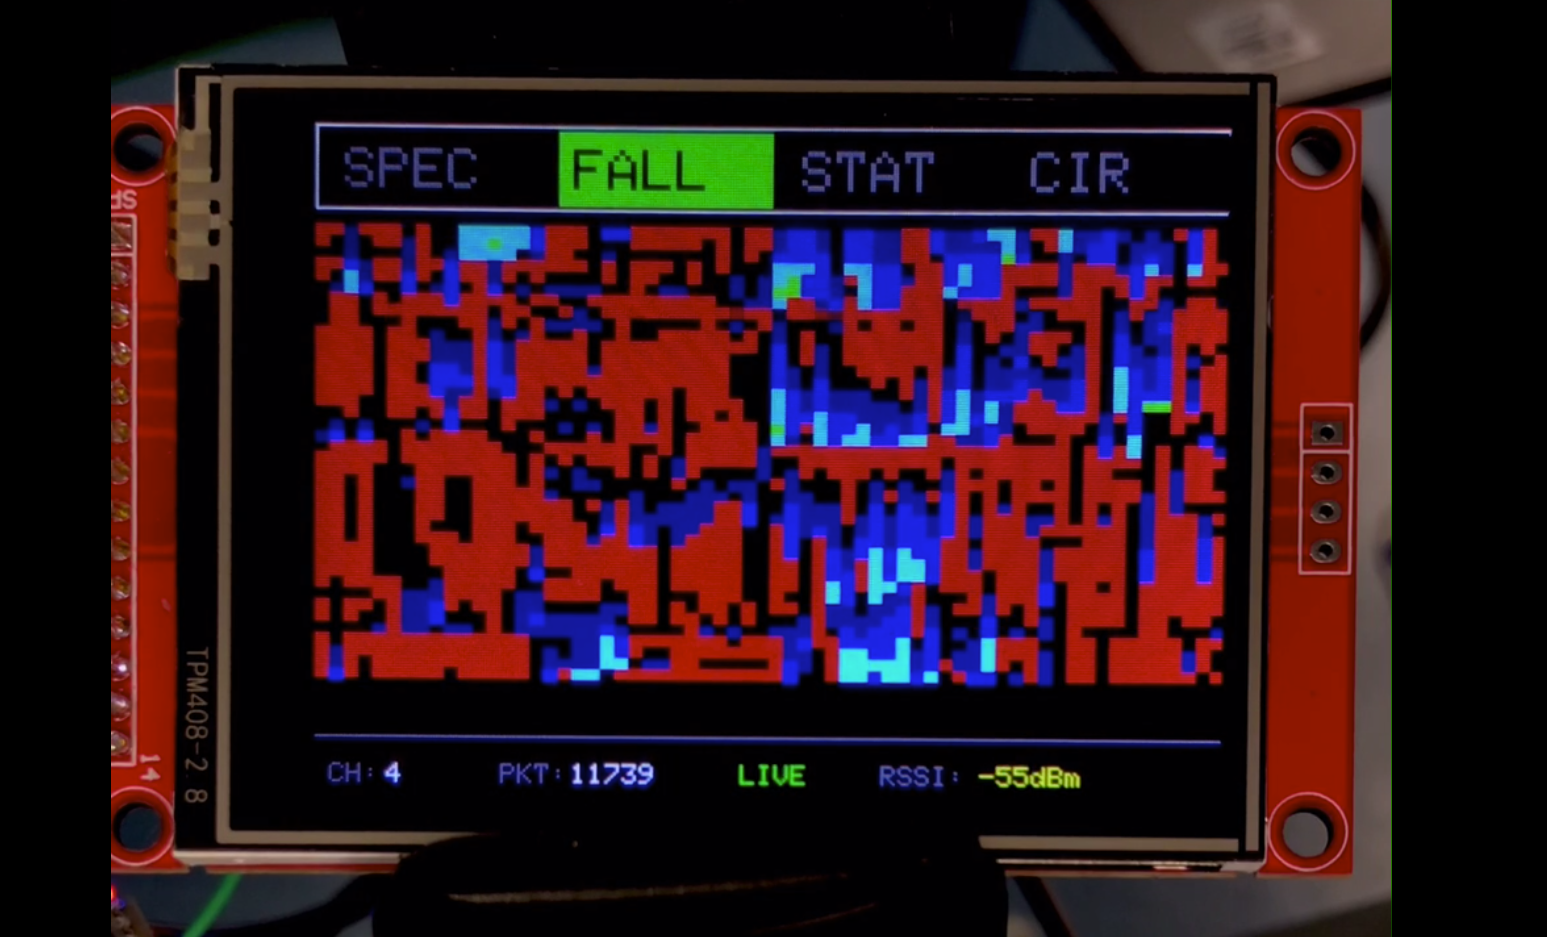
Live spectral analysis running on the 1.8" display.
Visual Modes
The various ways we render the invisible.
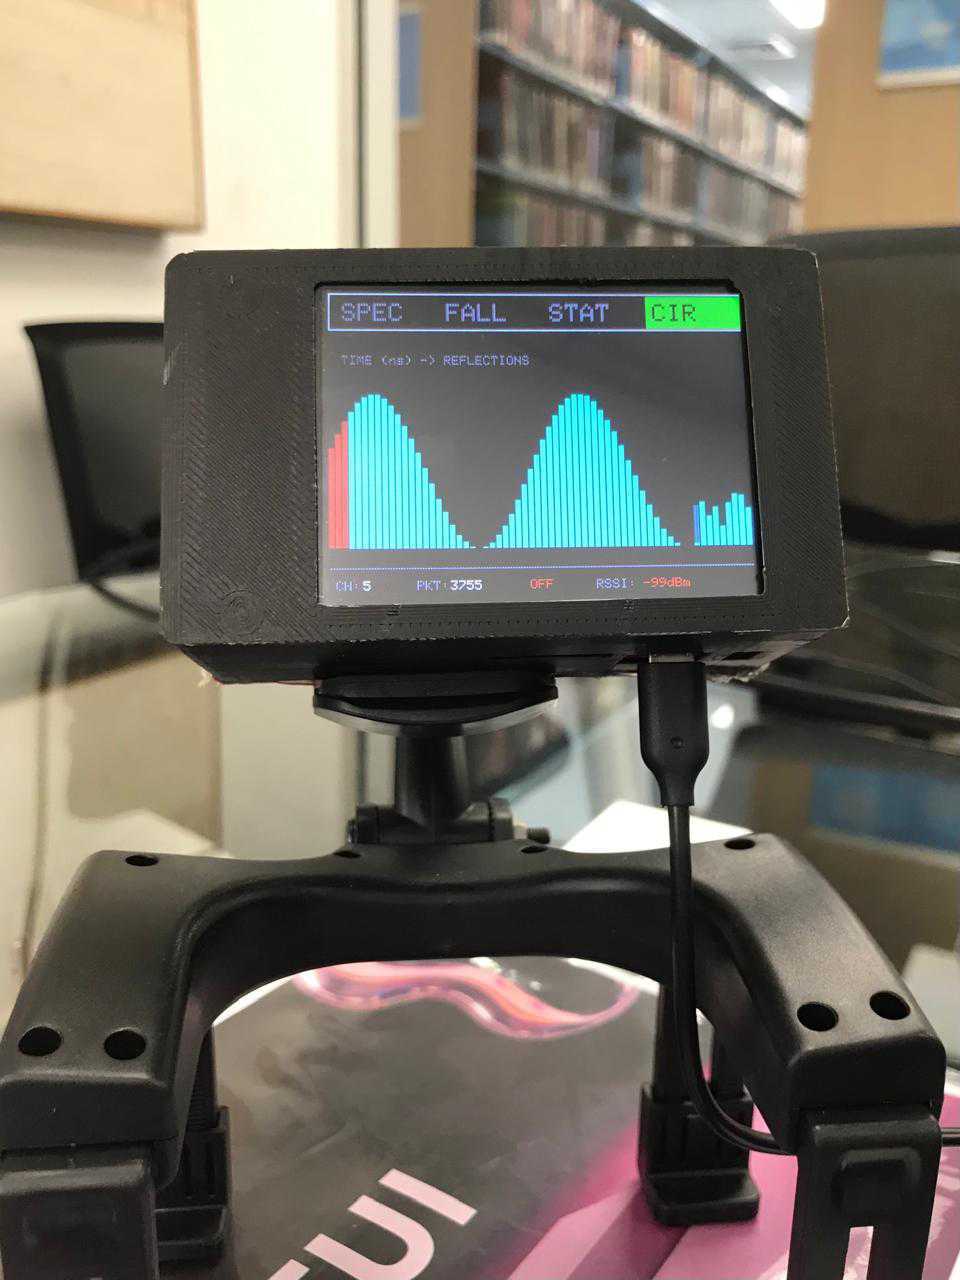
Spectral View
Real-time frequency domain representation of the Wi-Fi channel.
CSI Lite-TUI
A Handheld Scope for the Invisible World
Lightweight terminal UI for real-time Wi-Fi Channel State Information visualization — a portable spectral analyzer for the airwaves around you.
Portable Spectral Analysis
CSI Lite-TUI is a lightweight terminal user interface designed for real-time Wi-Fi Channel State Information (CSI) visualization. It acts as a portable spectral analyzer, allowing users to monitor and interpret wireless signals in their immediate environment.
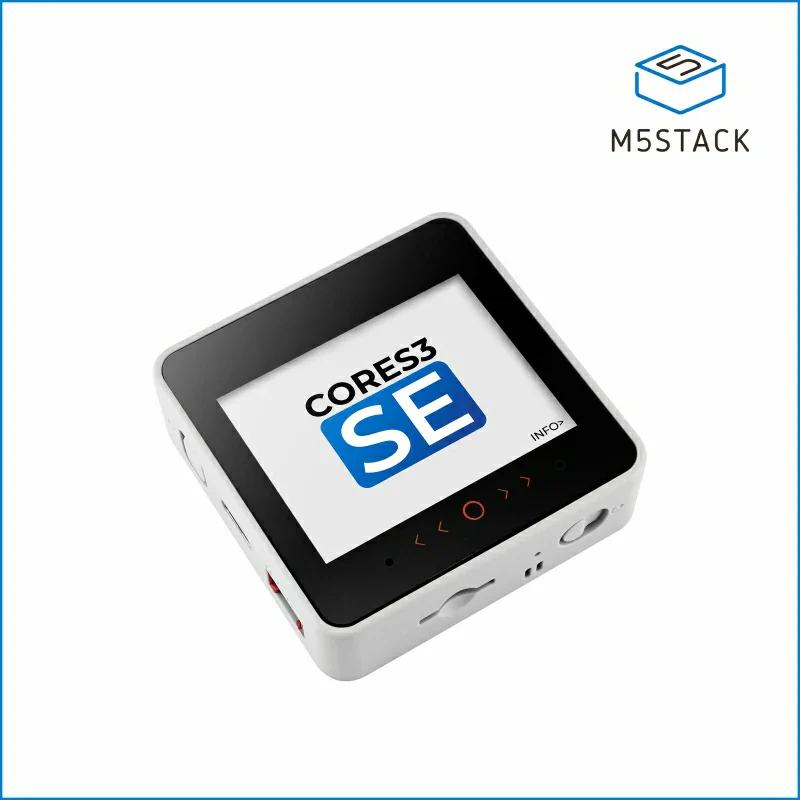
Supported Hardware
The system is strictly optimized for the M5Stack CoreS3 SE IoT Controller. It utilizes the device's compact form factor, physical touch interface, and robust ESP32 processing power for field operations.
- ▹ Touch-First Interface Physical tap controls for boot, mode selection, and in-field navigation.
- ▹ ESP32 Processing High-frequency CSI packet capture and real-time TUI rendering on-device.
- ▹ SD Card Edge Logging Onboard storage for raw CSV capture during deployment.
Core Features & Operations
Every visualization module in the CSI Lite-TUI stack.
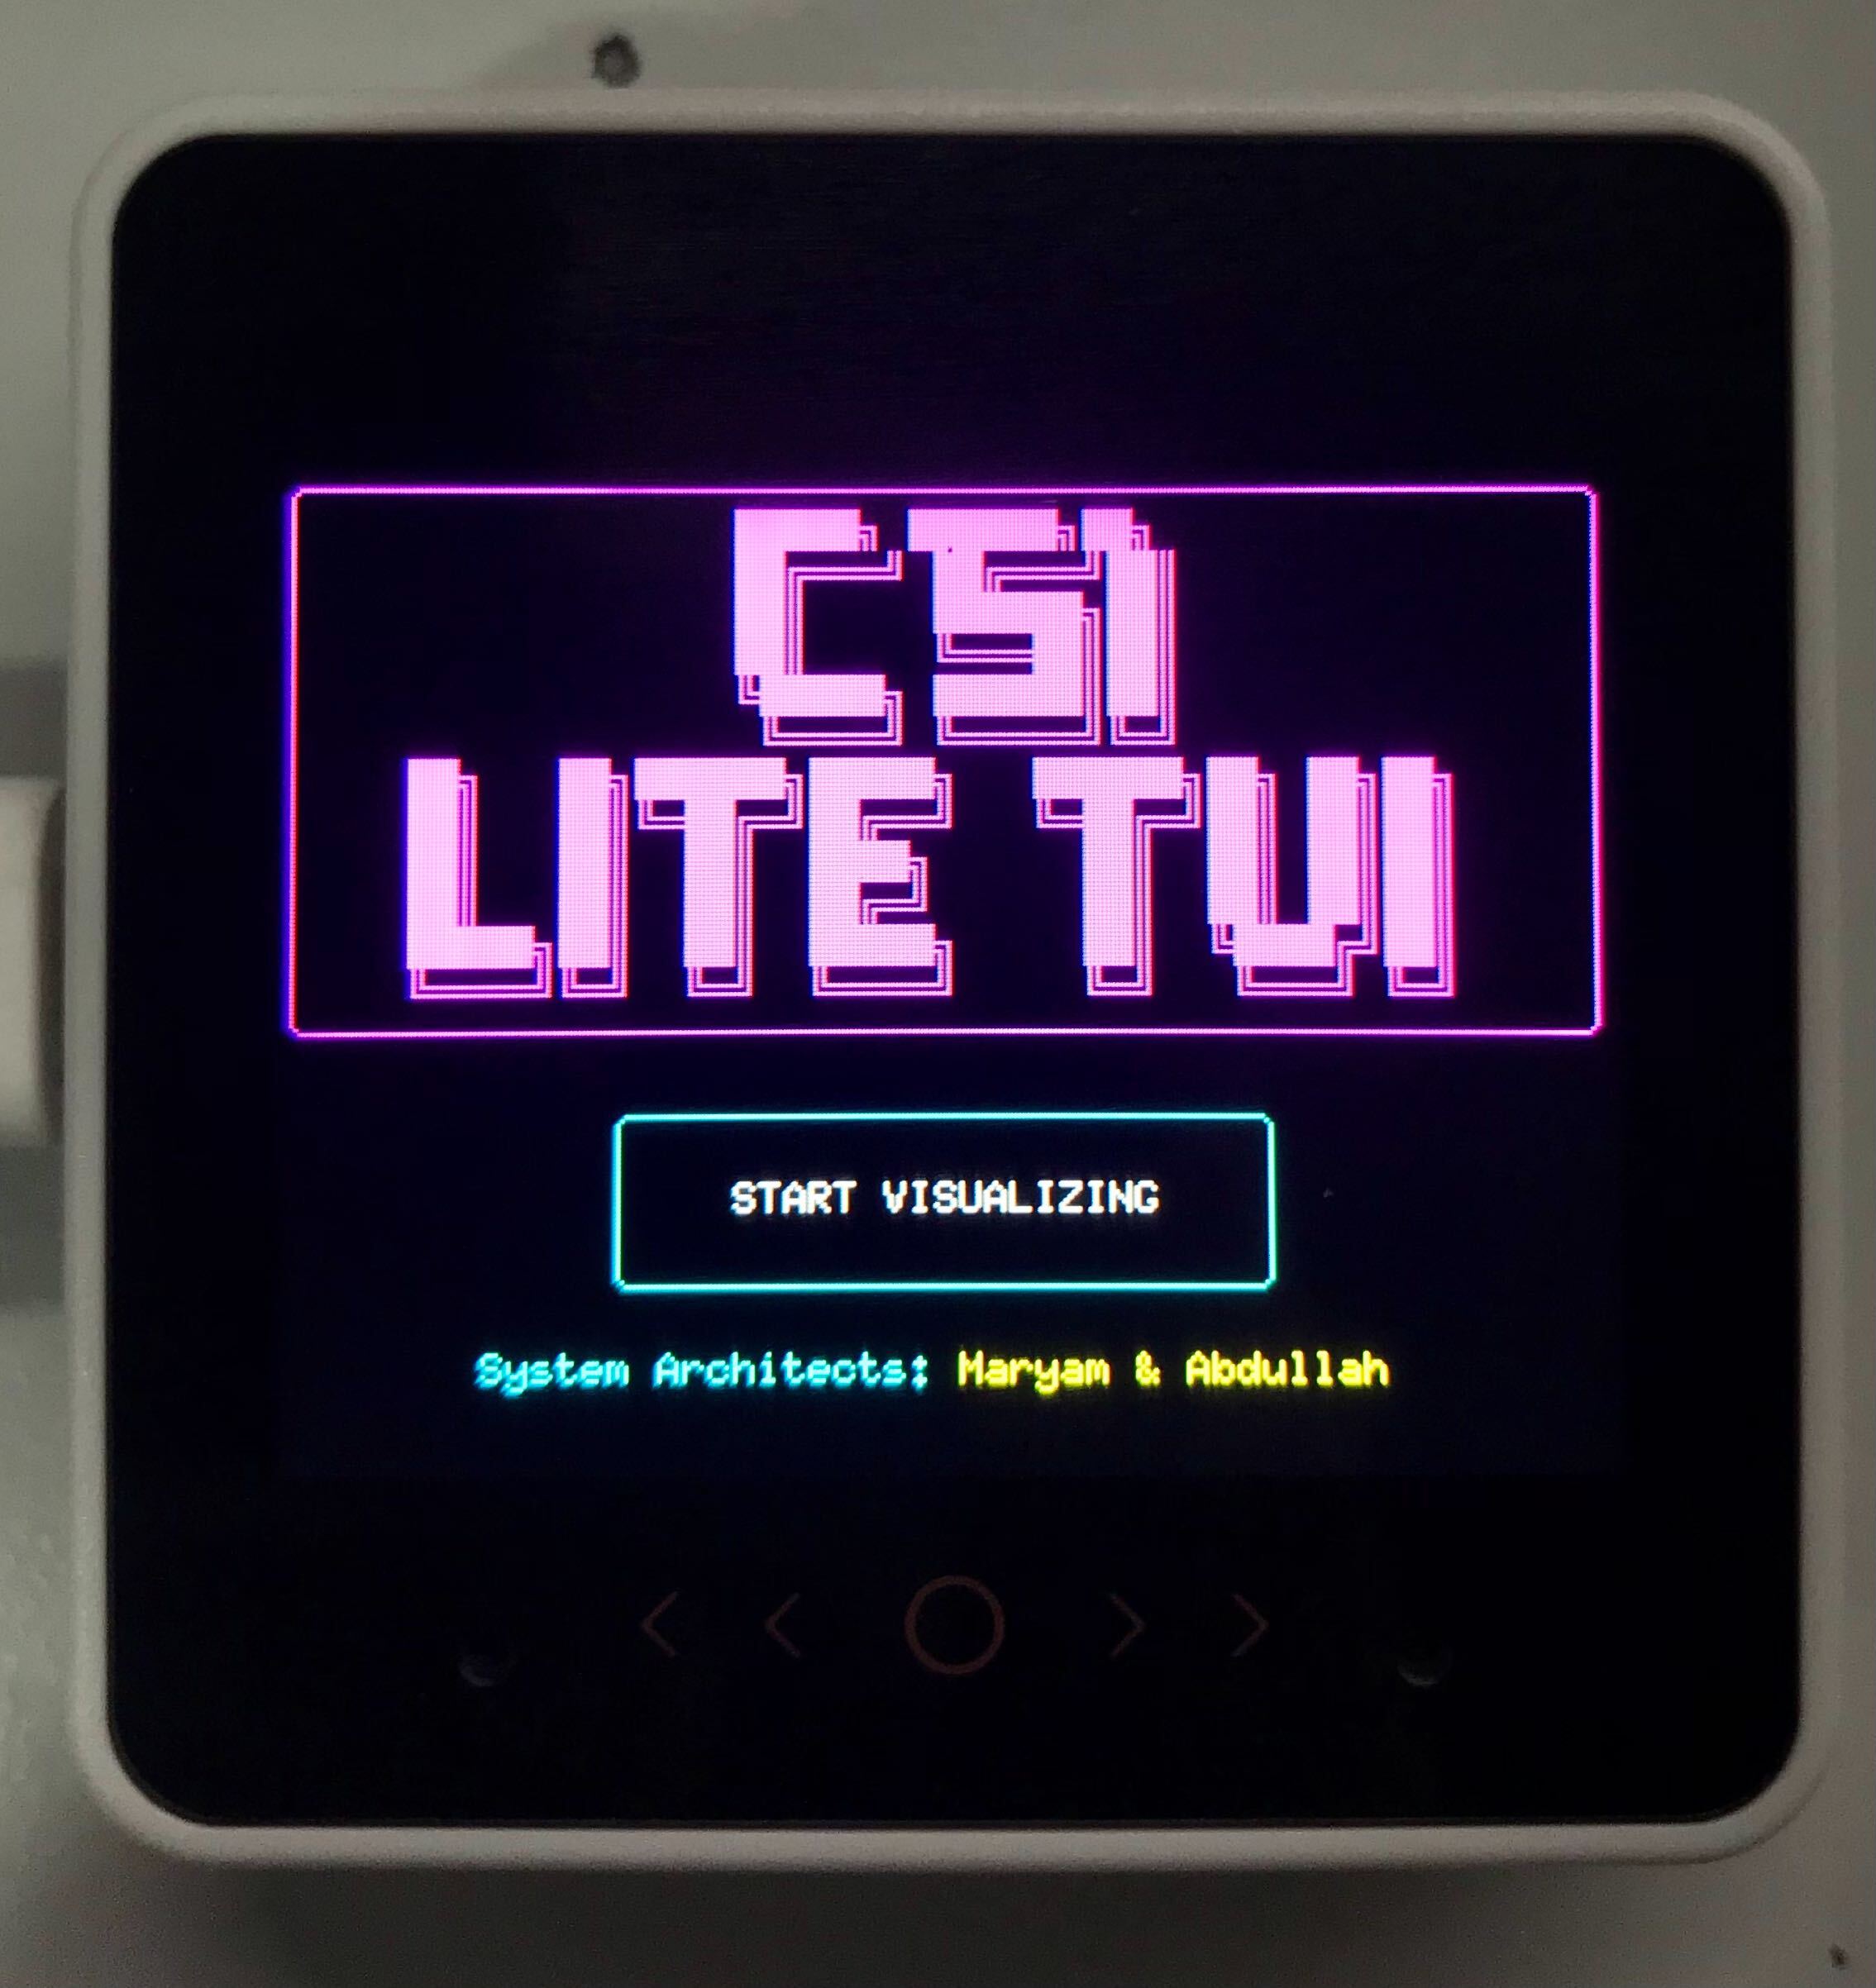
 BOOT
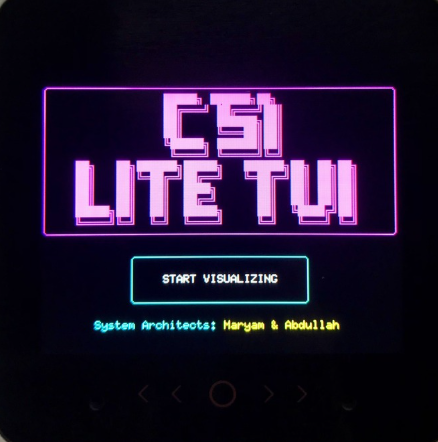
BOOT The Boot Sequence
A highly visible, zero-bloat, neon-styled retro TUI. Users initialize the radio and allocate memory by tapping START VISUALIZING.
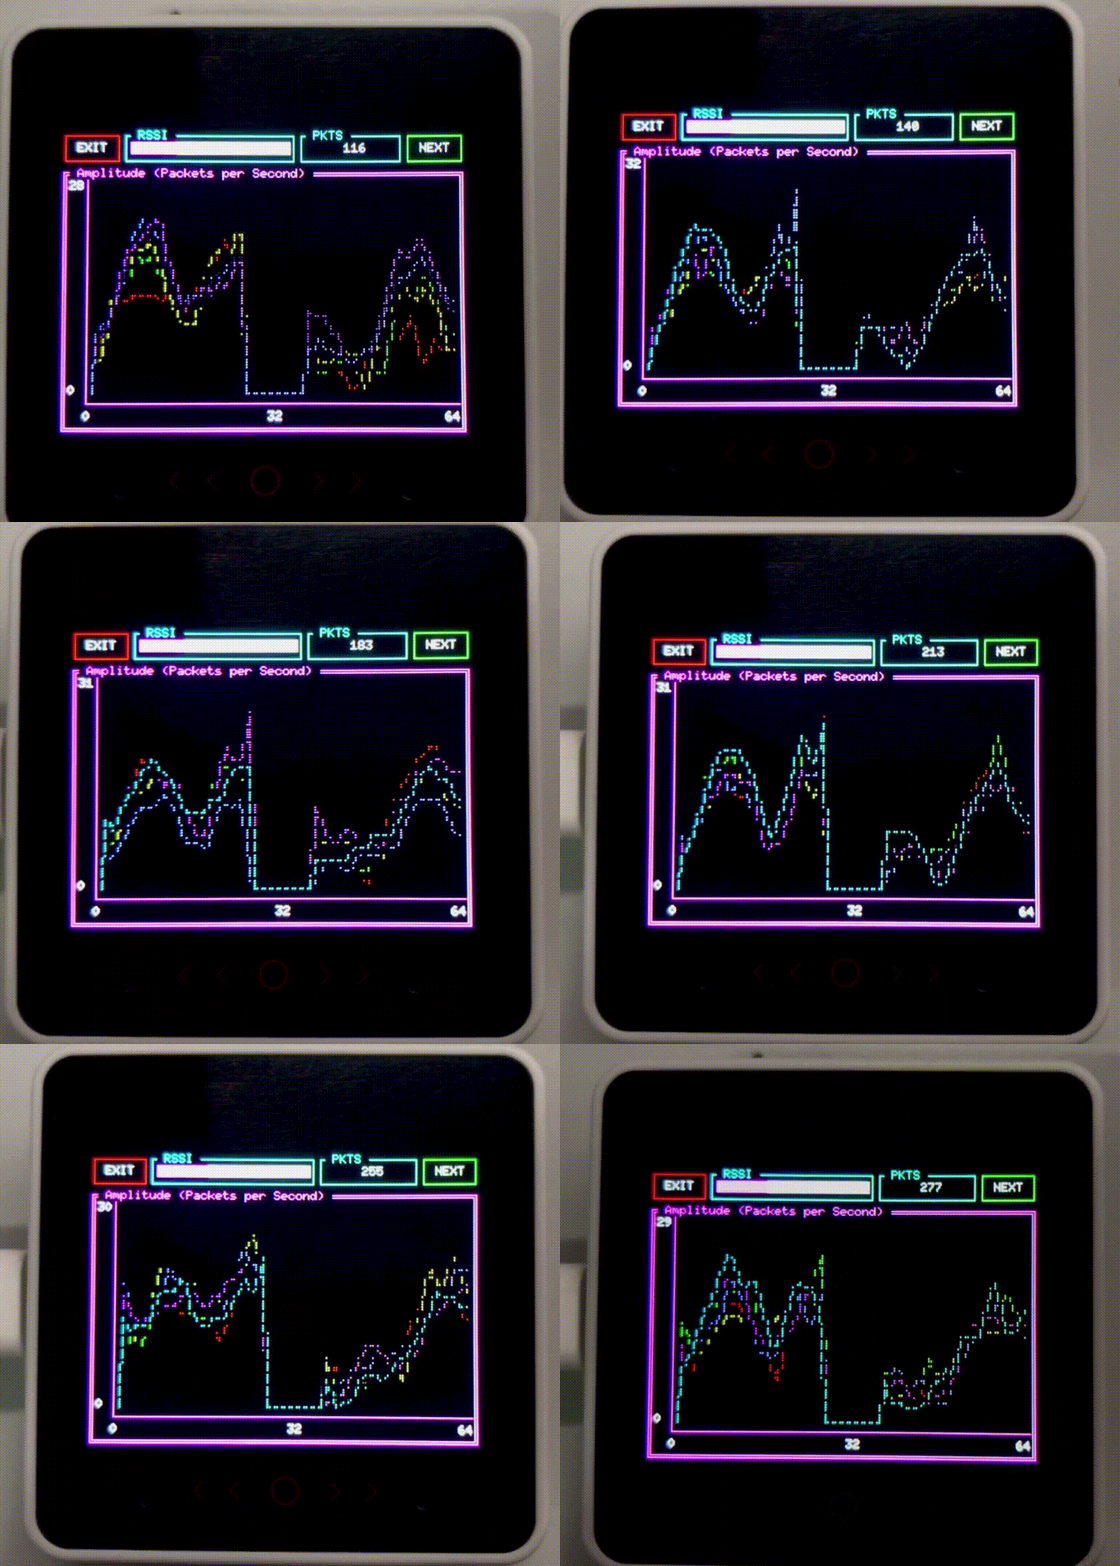
 AMPLITUDE
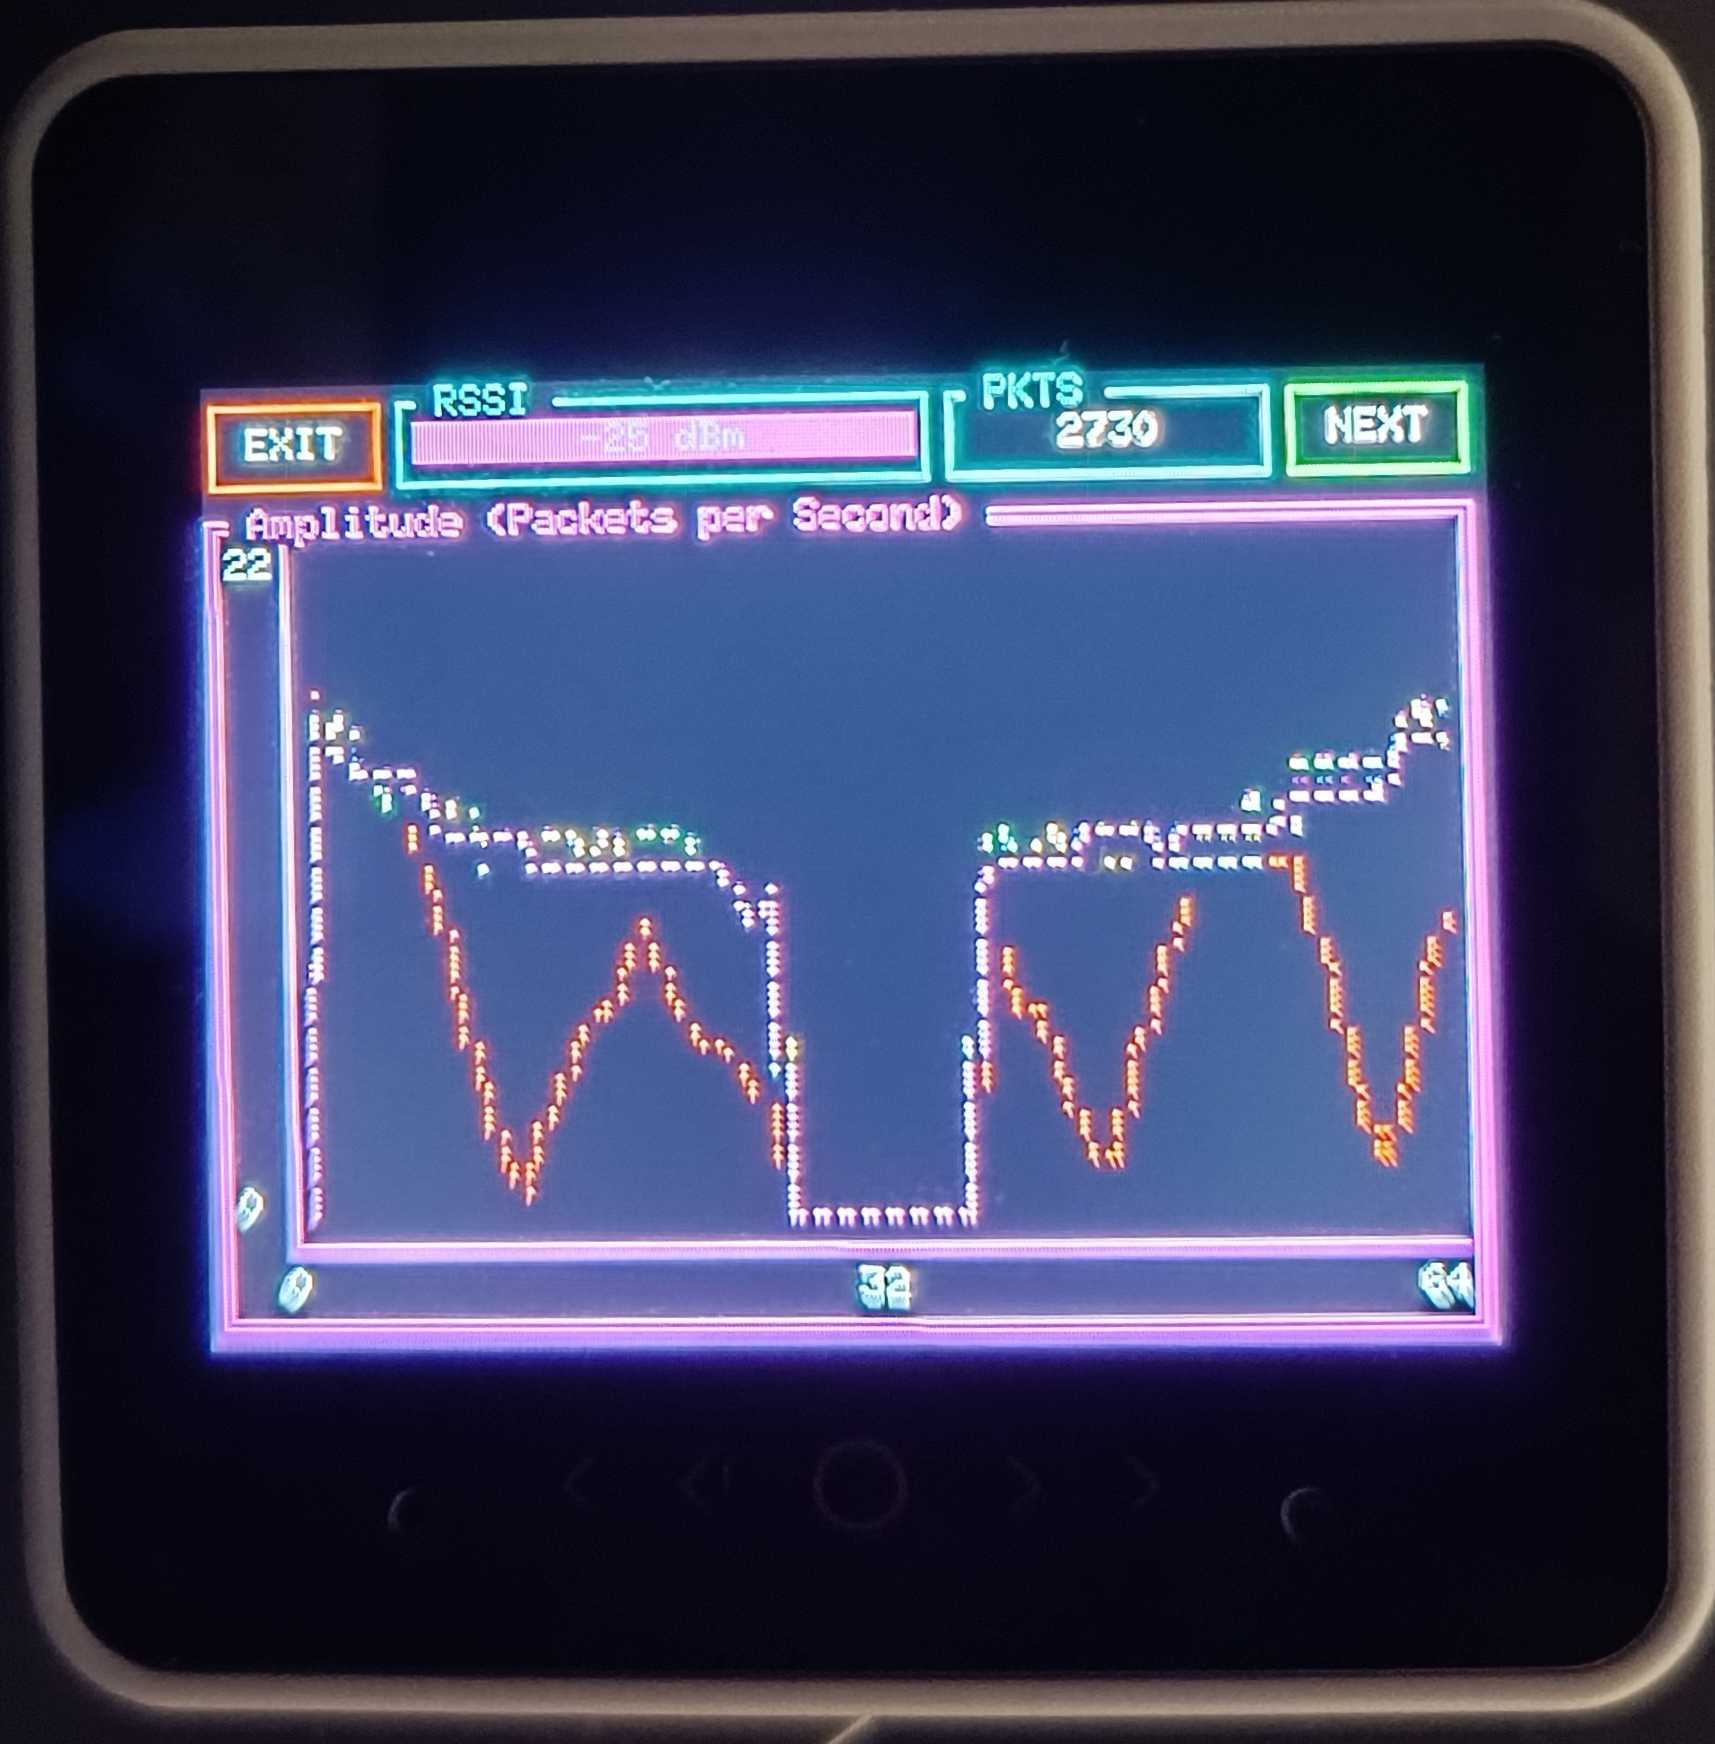
 Amplitude (Packets/Sec)
A real-time graph mapping amplitude across subcarriers to highlight network congestion, heavy data transfers, and high-bandwidth anomalies.
 PHASE
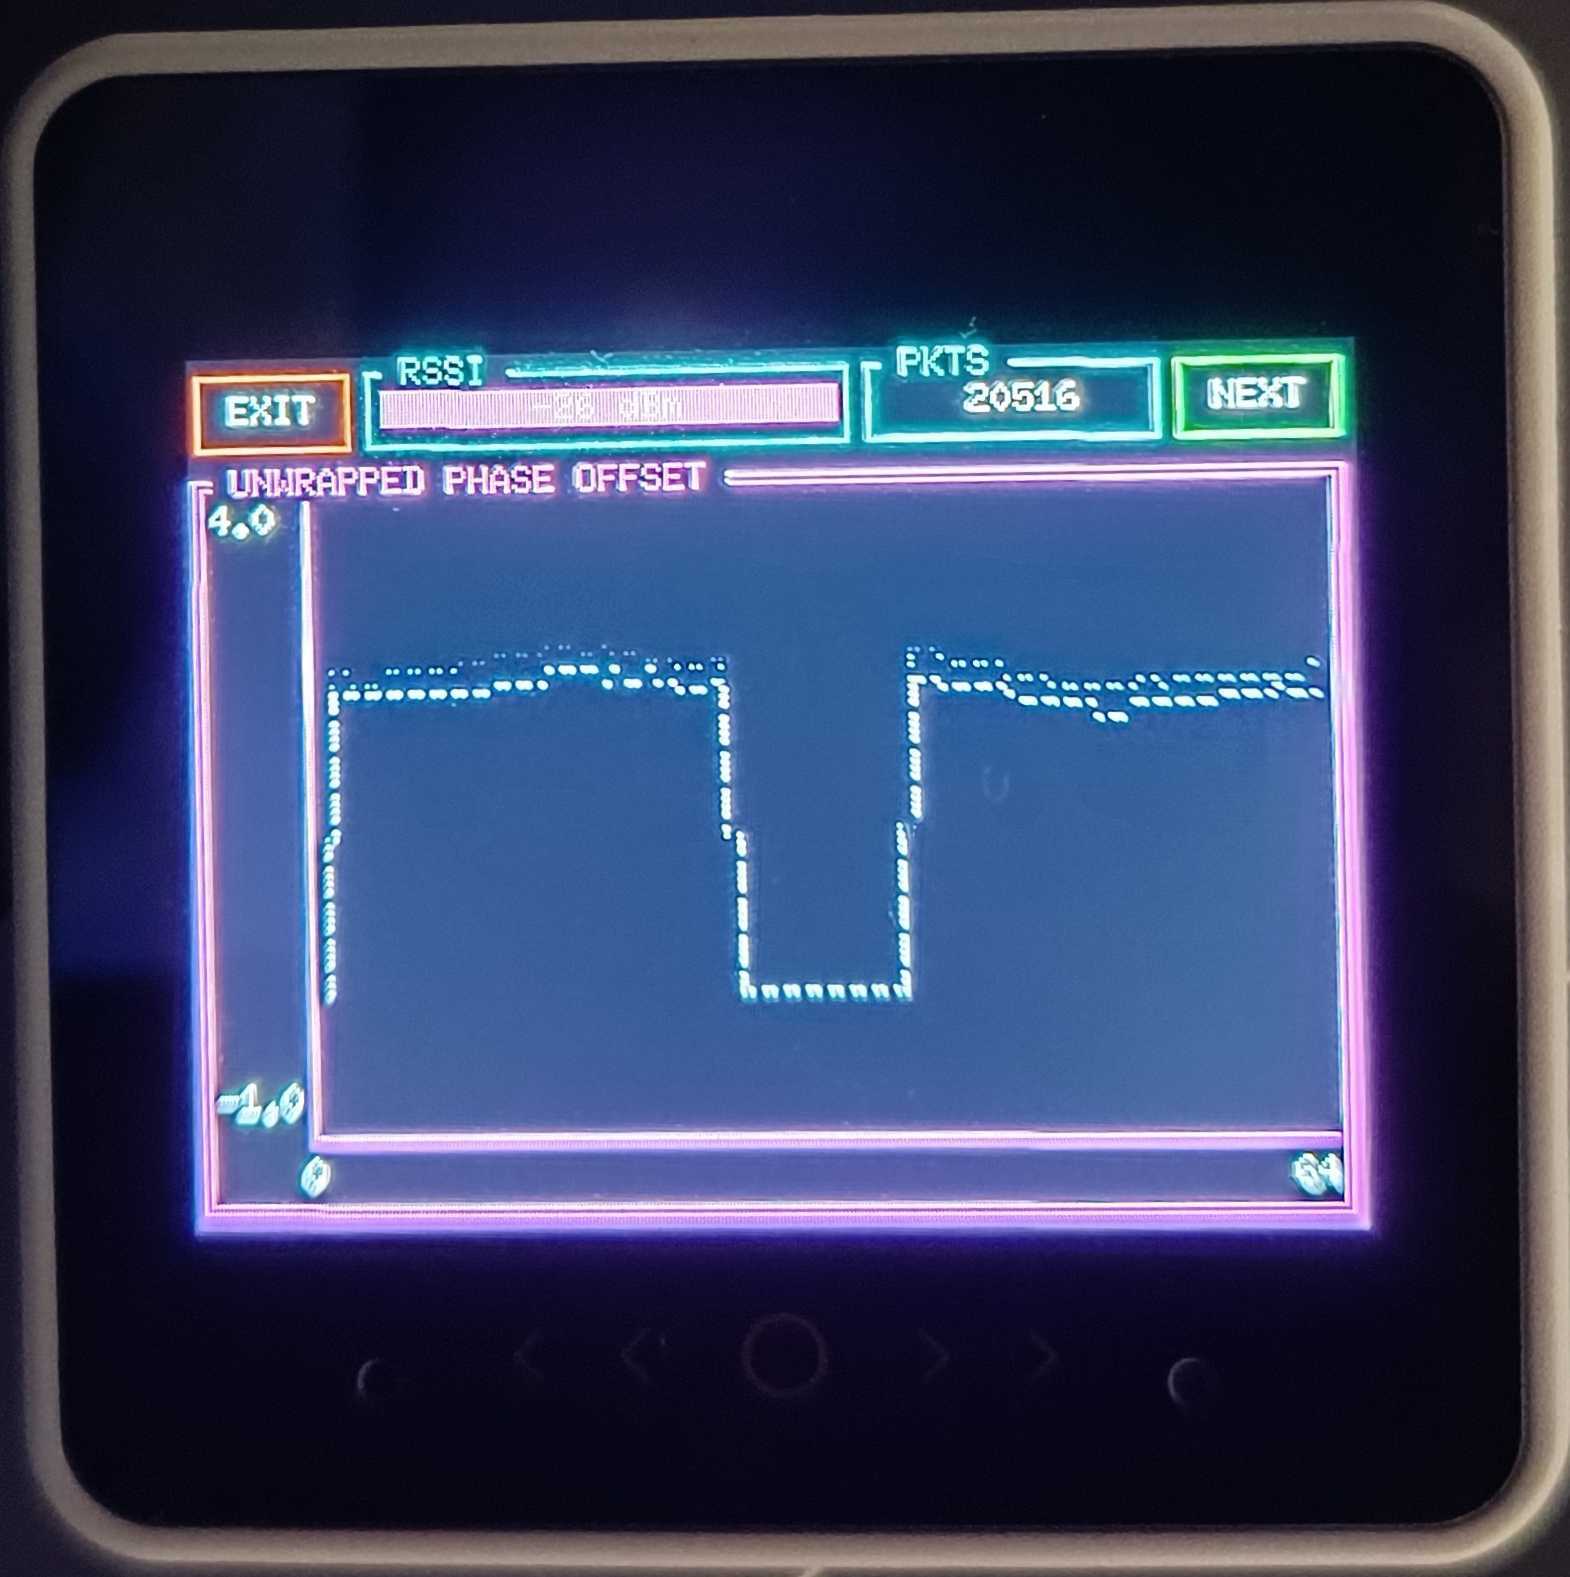
PHASE Unwrapped Phase Offset
Strips away noise to track physical signal properties, allowing for the detection of microscopic environmental shifts, physical movement, and multipath fading effects.
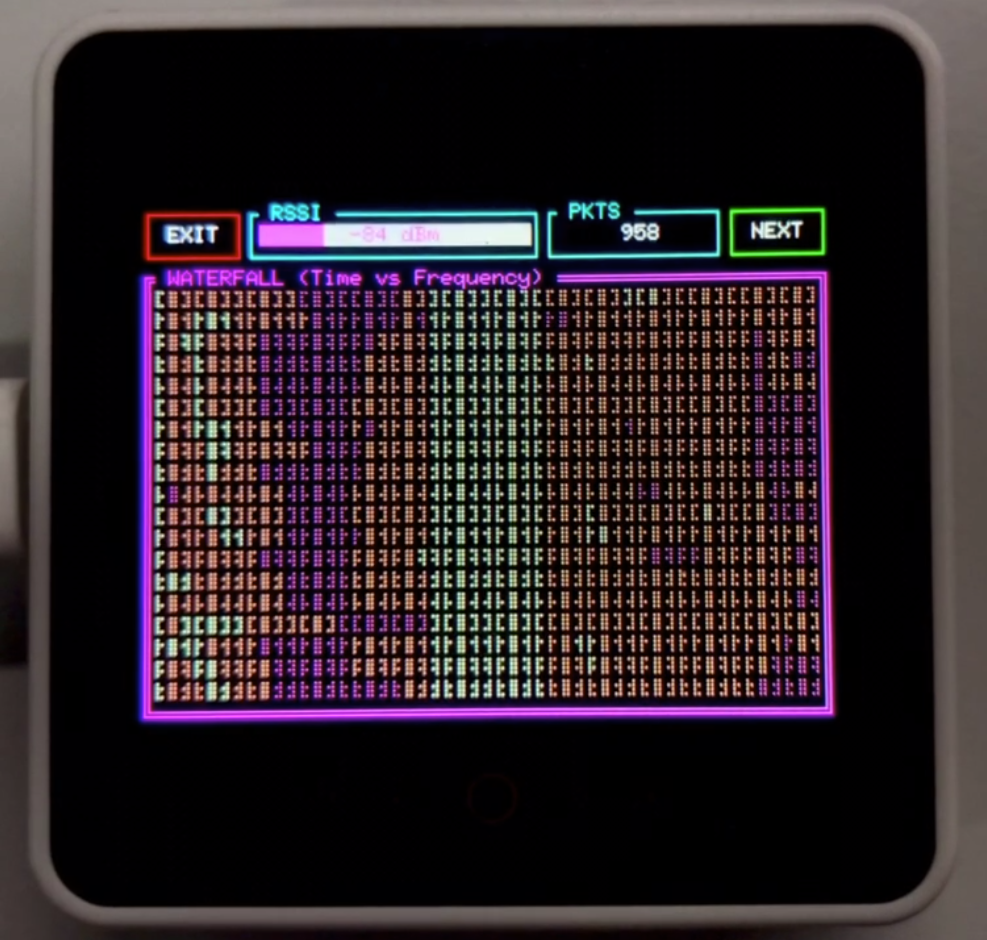 WATERFALL
 Spectral Waterfall
A scrolling color-map matrix that logs amplitude history over time — a heat map for the airwaves to track fleeting signal bursts, frequency hopping, and persistent noise floors.
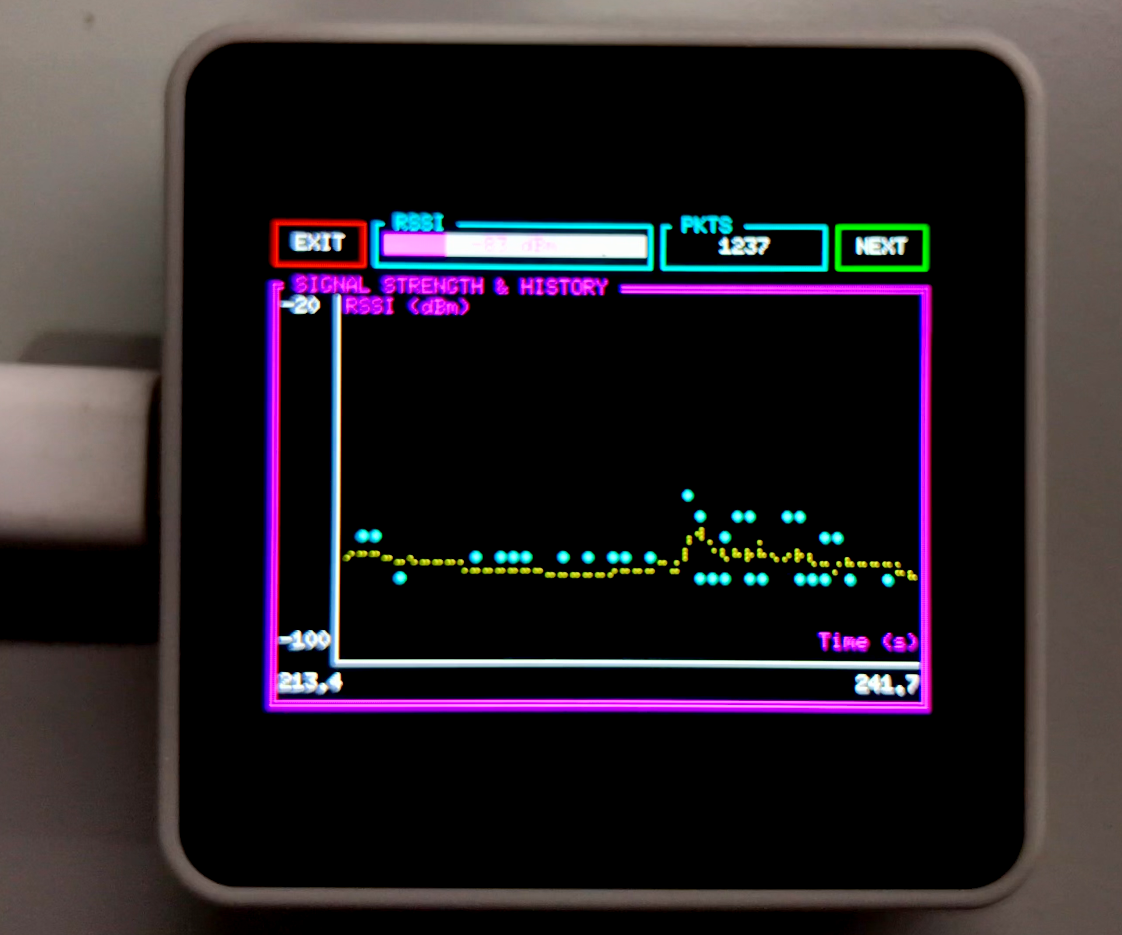 RSSI
RSSI Signal Strength (RSSI) & EMA
Plots the target's aggregate power (in dBm) over time. Uses an Exponential Moving Average (EMA) to smooth environmental spikes and show clear directional trends.
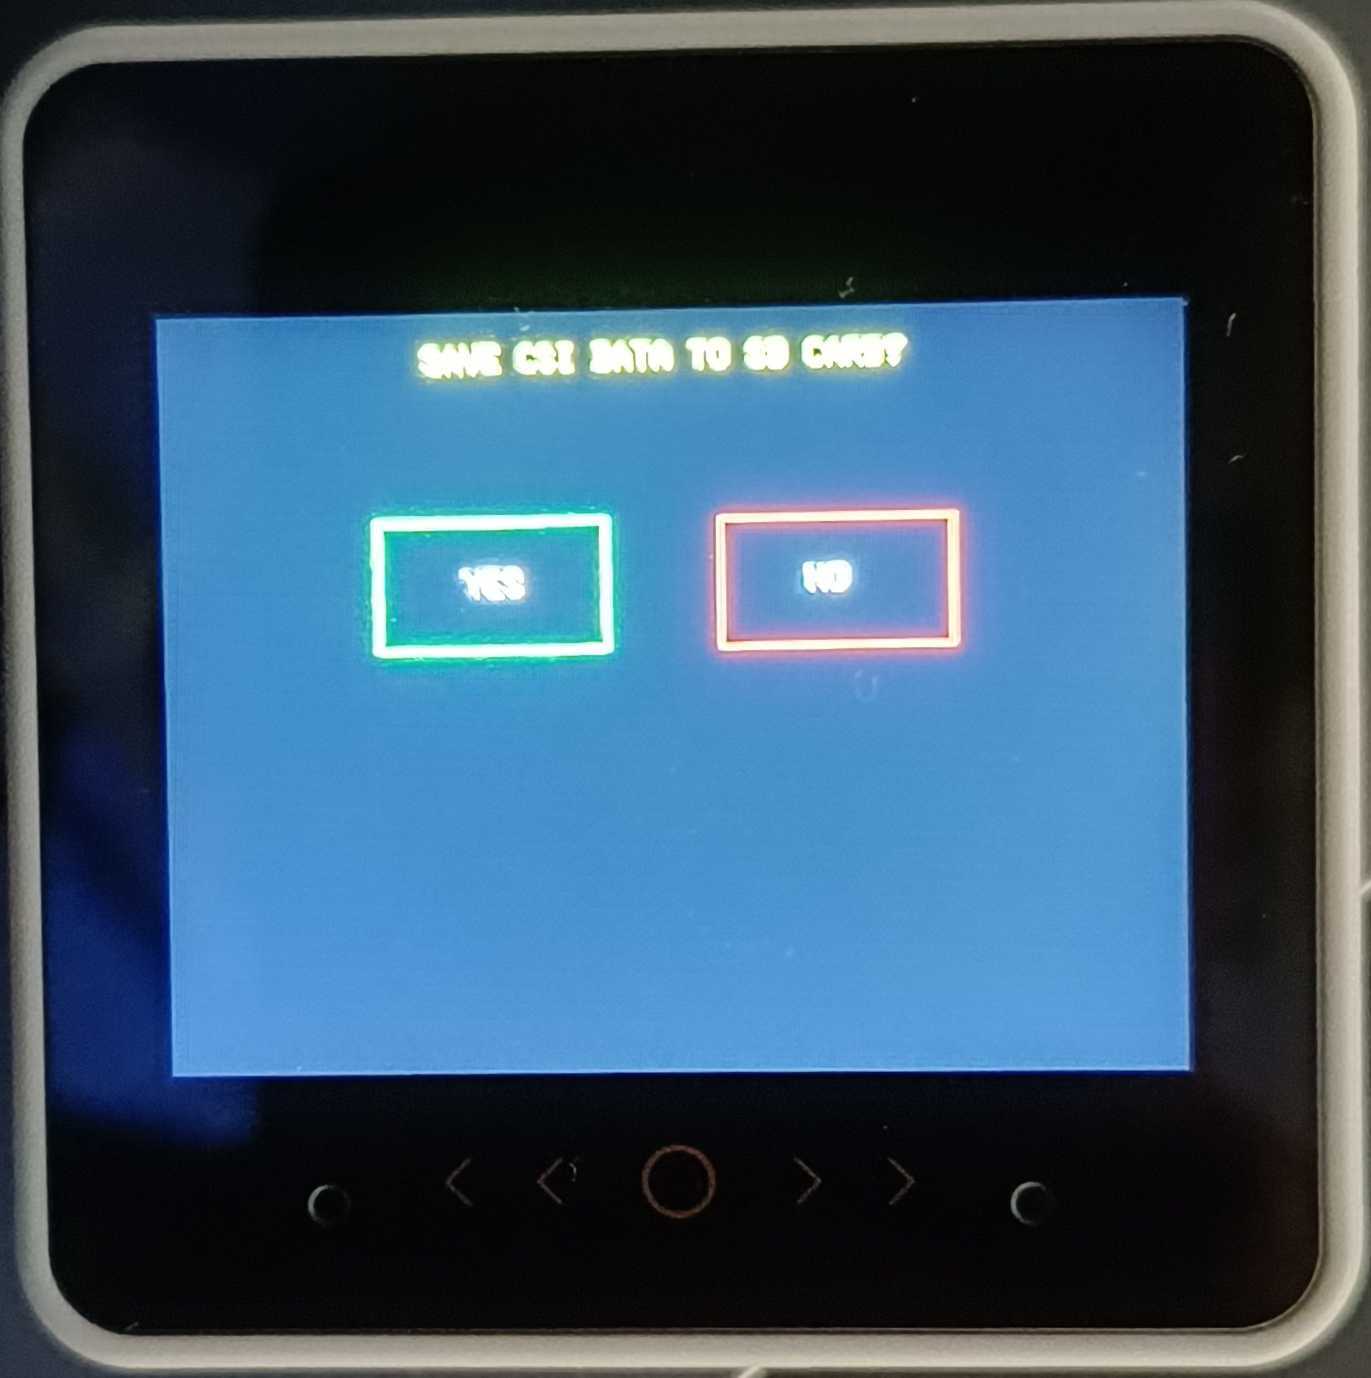 CSV LOG
 Edge Data Logging
Supports onboard SD card initialization to capture and save raw CSI data as CSV files for advanced, post-deployment machine-learning analysis.
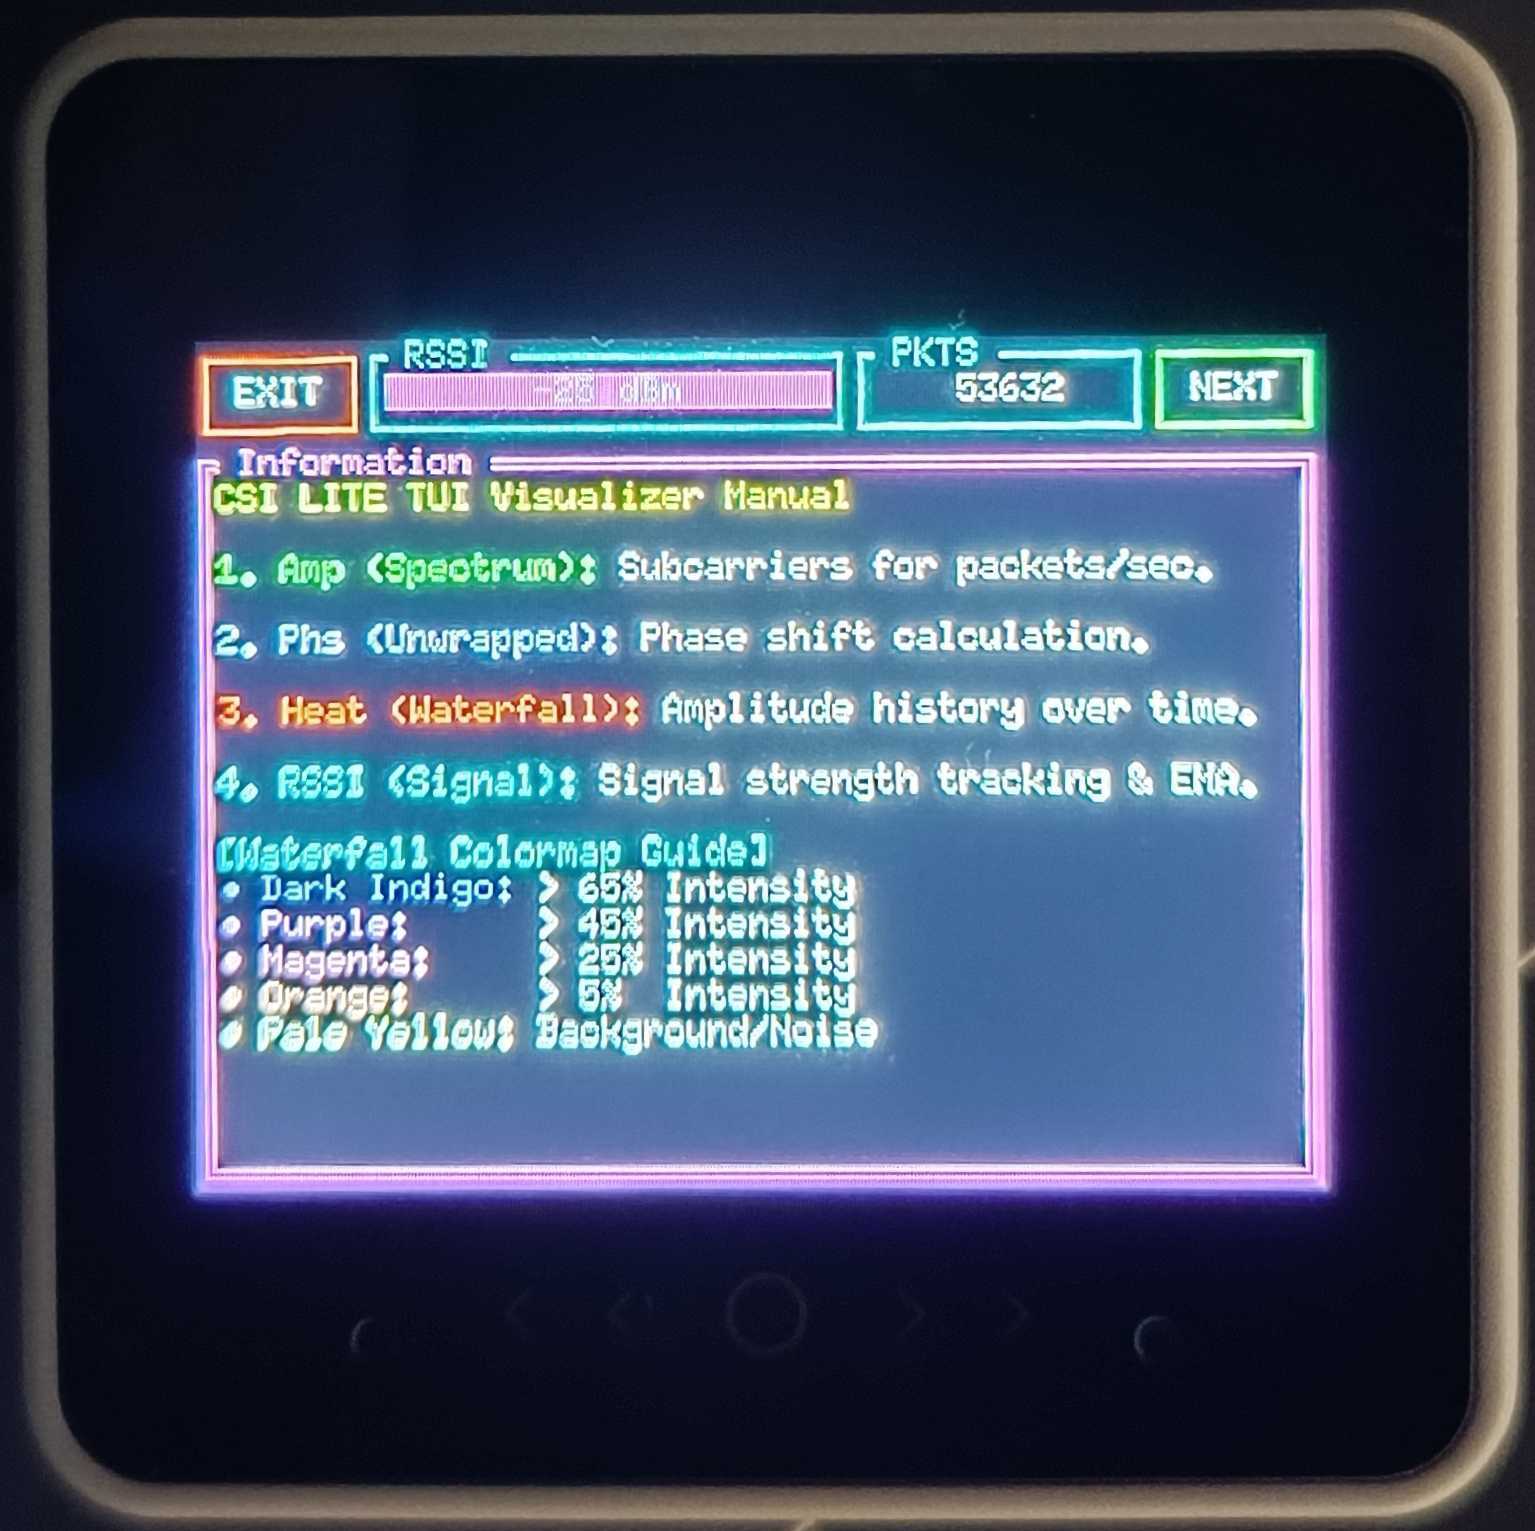 MANUAL
 On-Device Reference
A built-in tactical manual that provides quick refreshers on module definitions and color-coded intensity spectrums without interrupting workflow.
Deployment Modes
Adapt to different environmental topologies using three specific modes.
STATION MODE
Connects to a Wi-Fi network as a station client, capturing CSI from associated traffic and uplink activity.
SNIFFER MODE
Passive intercept mode — monitors all traffic on a specific channel without requiring a network association.
ESP-NOW MODE
Direct peer-to-peer ESP wireless protocol for low-latency CSI exchange between devices in the field.
Live Module Demos
Screen recordings from the M5Stack CoreS3 SE display.
Project Information
System Architects & Authors
- Maryam Odat modatt mariam.odat97@gmail.com
- Abdullah Al-Awad Abdullah-Alawad abdullahalawad123321@gmail.com
License
Apache License, Version 2.0
Open-source distribution under the Apache 2.0 license — free to use, modify, and deploy with attribution.
Interface Gallery
Screens, modes, and field captures from CSI Lite-TUI.
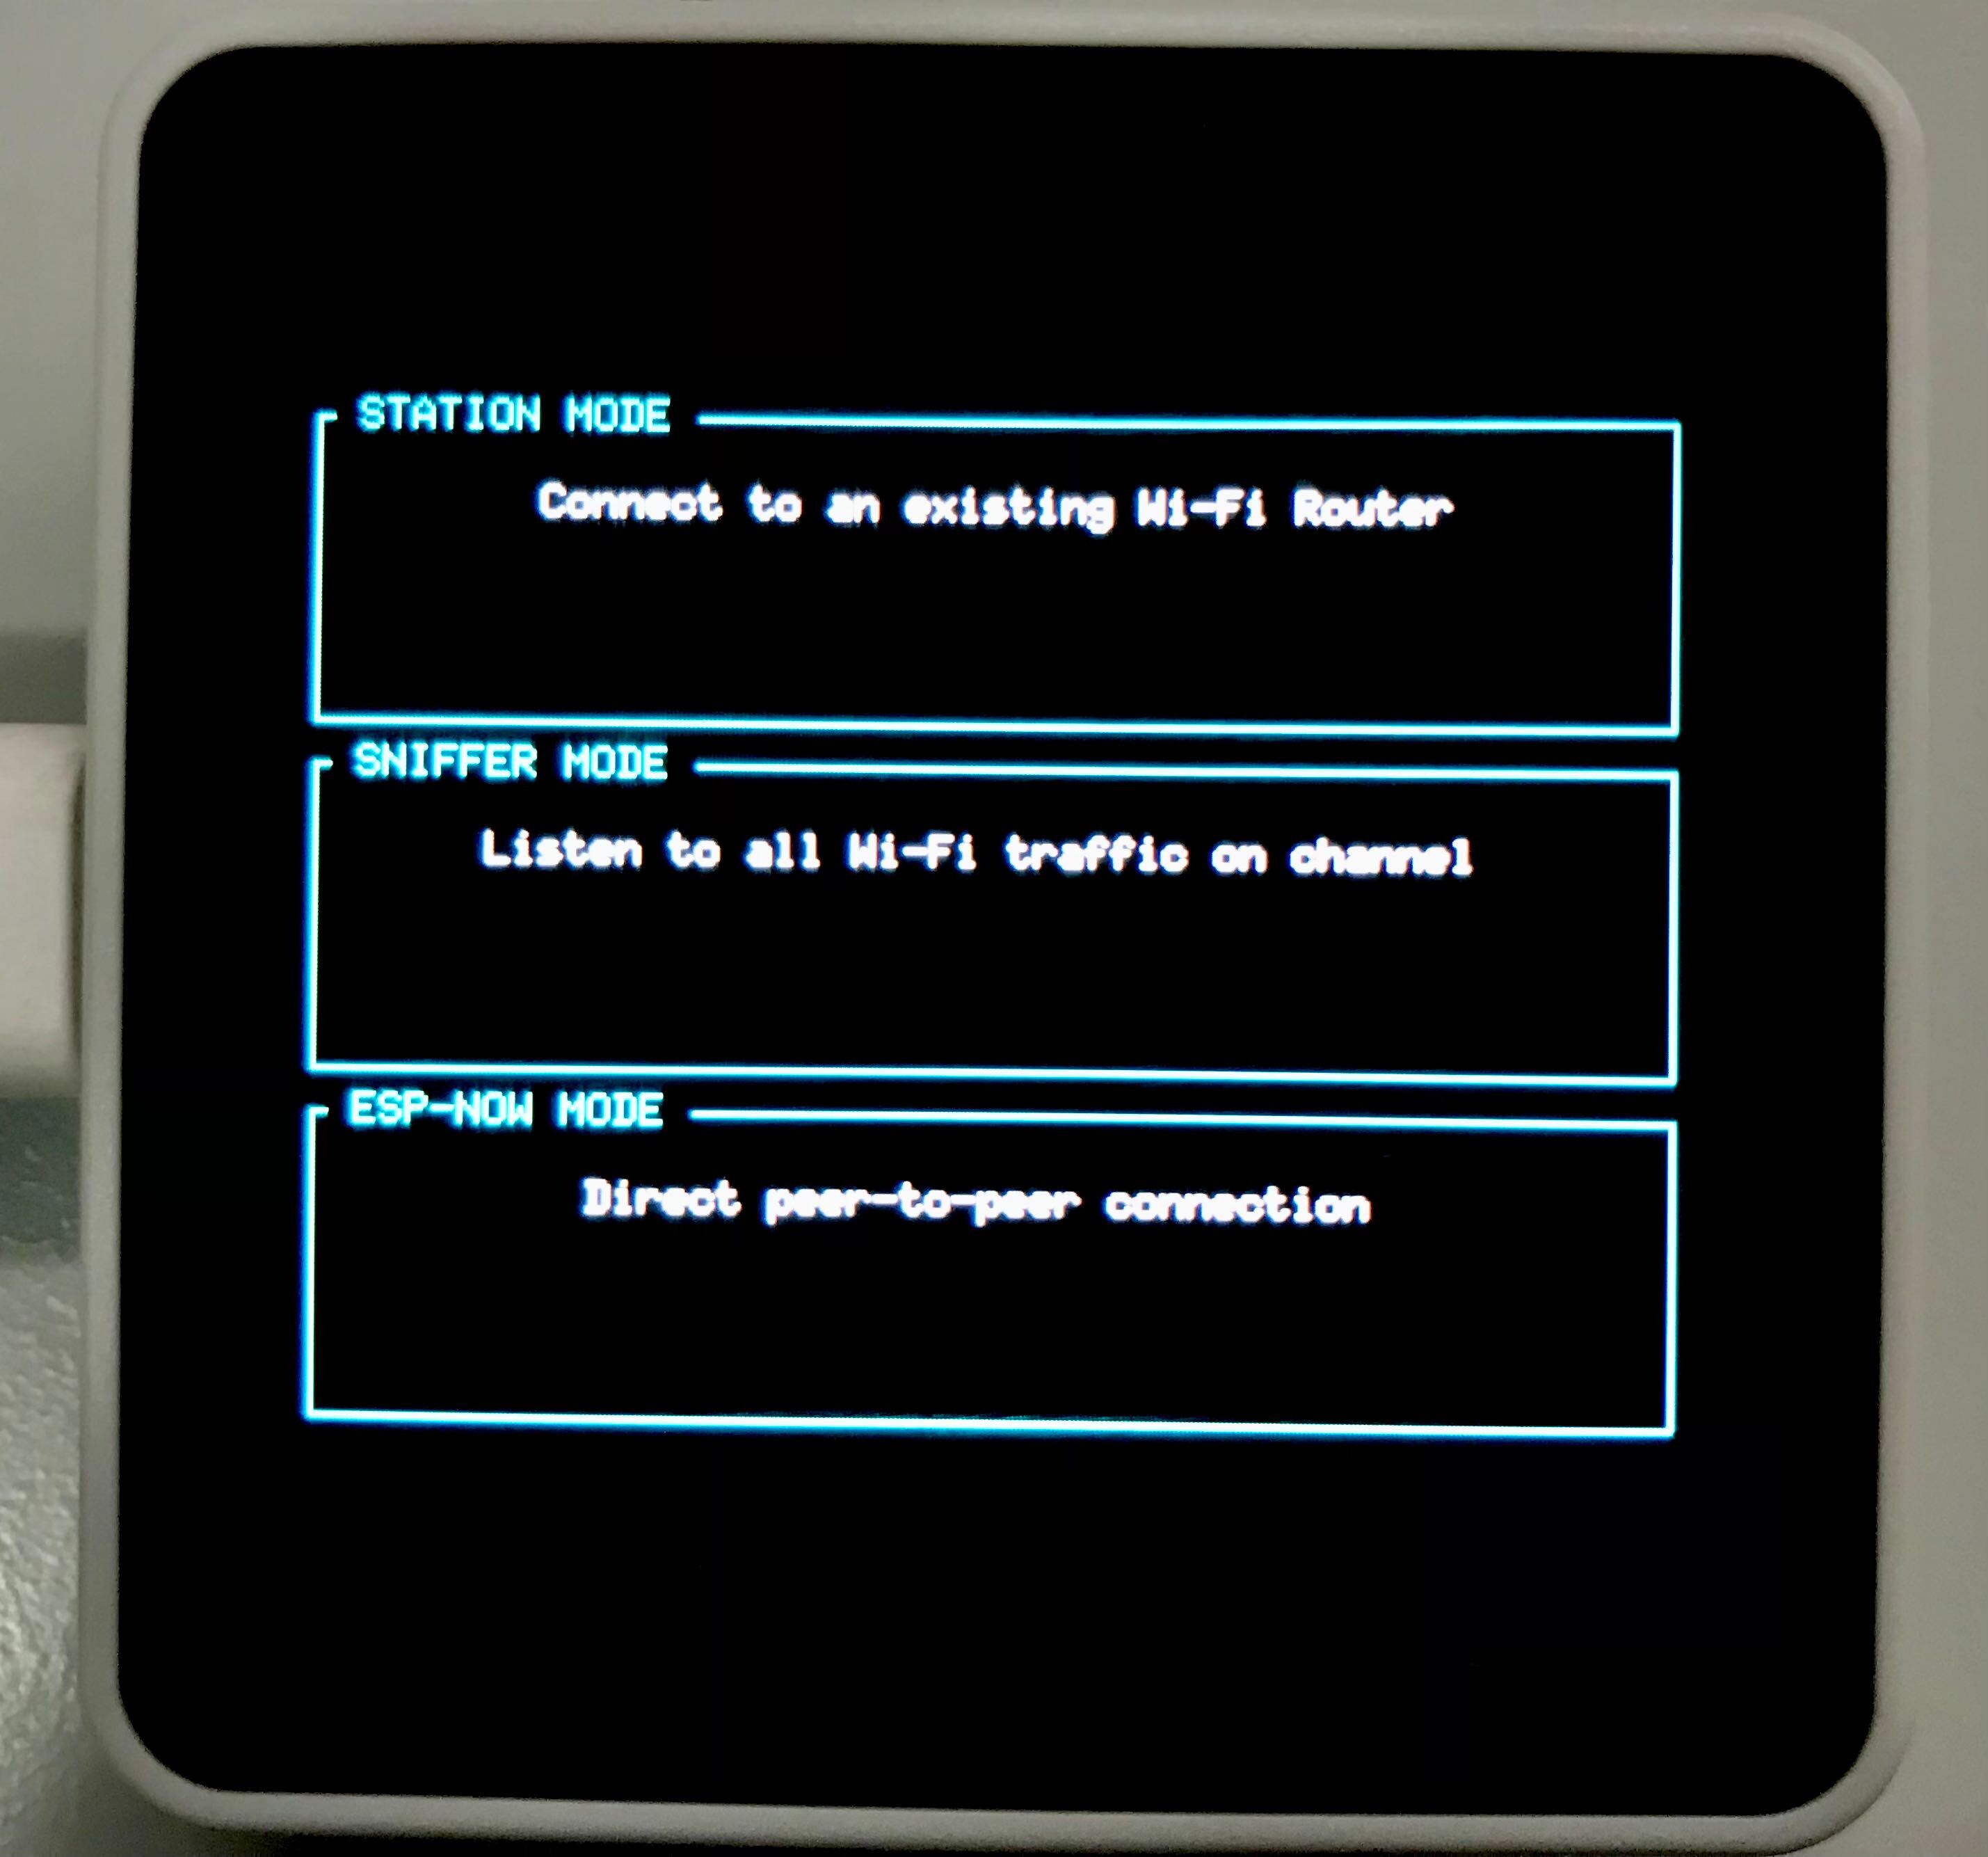
Mode Selection
Choose between Station, Sniffer, and ESP-NOW deployment topologies from the main menu.